Publication: Local government in Scotland: Financial overview 2015/16
Councils have managed their finances well but significant challenges lie ahead, says the Accounts Commission.
Please note that paragraph 44 and exhibit 6 of this report have been updated post publication to correct an error identified in supporting data.
- File type:
- File size:
- 3.73 MB
All files
- Main report (text only)
- File type:
- - rtf
- File size:
- 178.97 KB
- Supplement 1 - Self-assessment tool for councillors
- File type:
- File size:
- 576.29 KB
- Supplement 1 - Self-assessment tool for councillors (text only)
- File type:
- - rtf
- File size:
- 29.9 KB
- Supplement 2 - Local Government Pension Scheme 2015/16
- File type:
- File size:
- 773.95 KB
- Supplement 2 - Local Government Pension Scheme 2015/16 (text only)
- File type:
- - rtf
- File size:
- 10.09 KB
- News release
- File type:
- File size:
- 36.74 KB
- Podcast
- File type:
- - mp3
- File size:
- 3.45 MB
- Podcast transcript
- File type:
- - rtf
- File size:
- 41.98 KB
- nr_161129_local_government_finance.xlsx
- File type:
- -
- File size:
- 540.82 KB
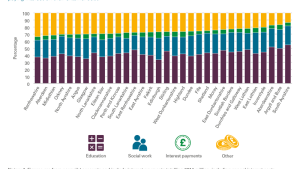
Spending across service areas in councils
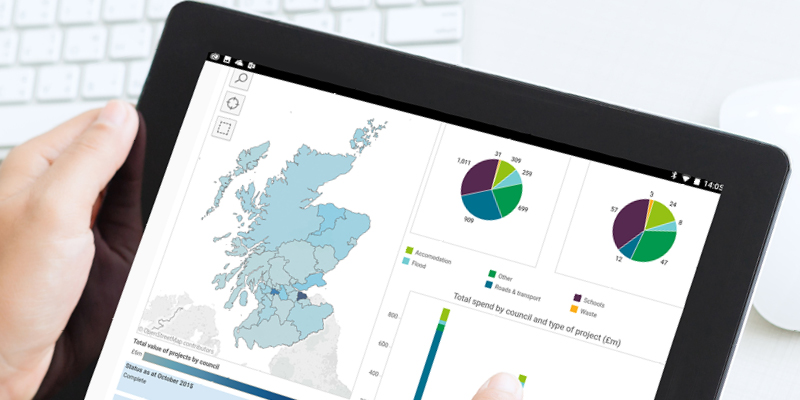
Our interactive graphic compares individual councils with others in the rest of Scotland. This was originally compiled for our report, An overview of local government in Scotland 2016, and has been updated for 2015/16.

Data from the accounts
Councils produce annual accounts on an annual basis for financial years ending 31 March. Draft or unaudited accounts are published each year by 30 June and we ask auditors to submit a return based on this unaudited information. We compile a database that allows auditors to carry out high level comparative analysis between councils as part of the audit process.
In recent years we have updated the unaudited accounts database for changes made to annual accounts as a result of audit and we have created a spreadsheet to allow this information to be compared across years.
The workbook below provides an extract from this spreadsheet and focuses on three of the major financial statements from the accounts - Movement in Reserves Statement, Comprehensive Income and Expenditure Statement, and Balance Sheet.
About the data
The Movement in Reserves Statement (MIRS): This statement contains the opening and closing balances of the different reserves held by councils. It also records any adjustments to and from reserves that councils must make to meet statutory obligations.
The Comprehensive Income and Expenditure Statement (CI&ES): This statement shows what councils have spent on individual services, other operating costs such as interest costs and sources of council income such as Scottish Government grants and council tax.
The Balance Sheet (BS): This statement shows everything that councils own (assets), what they owe (liabilities) and how they have financed this as shown in the balance of their reserves.
The source of each item in the spreadsheet is shown by the inclusion of the relevant abbreviation. Figures that are a combination of others include the word ‘overview’ in their title. These can also be identified on the ‘Data’ worksheet as they are coloured orange. This method can also be used to identify how these have been calculated.
Data for 2014/15 and 2015/16 is derived from audited accounts and has undergone some cross checking and validation. However, there are some limitations to the data for earlier years which is based on the unaudited accounts and has not been updated for any restatements arising from changes in accounting policy or correction or material errors in subsequent years.
We have also included some contextual information from National Records of Scotland (population and number of households) and from Scottish Government statistics (staffing and pupil numbers). This has been mapped across financial years to allow different types of analysis to be carried out.
To allow real terms analysis to be carried out we use HM Treasury GDP deflators to adjust values for inflation. This is the standard way of analysing public sector expenditure. The date these GDP deflators were published is included in the workbook and they are consistent with those used in ‘Local government in Scotland: Financial Overview 2015/16’.
About the workbook
The workbook consists of a main input sheet that controls a series of charts and tables. The yellow cells on the input sheet can be used to select items from drop down lists:
- ‘My council’: an individual council to be compared to national figures
- ‘Item to be analysed’: a single item of contextual information or information from the accounts
- ‘Cash or real terms’: to select if you would like to see the figures unadjusted (cash terms) or adjusted for the effects of inflation (real terms).
- ‘Base year’: for real terms analysis this will allow you to select the year you want the others to be adjusted to.
- ‘Comparator councils’: four other councils to produce comparisons that will appear on the charts
In the ratio section of the input sheet you can then select:
- ‘Item 1’: a single item of contextual information or information from the accounts which will be the numerator in your ratio
- ‘Item 1’: a single item of contextual information or information from the accounts which will be the denominator in your ratio
- ‘Year to display on single chart’: the year to display on the ratio charts that show a single year.
These selections generate a series of charts that can be found on the ‘Charts’ and ‘Ratio Charts’ sheets. These can then be accessed using the hyperlinks in the workbook or by selecting the individual worksheets.
The remaining three sheets will show you the items you have selected but for all 32 councils, also allowing you to select years to auto calculate changes between years, and the raw data the workbook uses.
